Correlation between
EVS’ PRICE
and Global Climate Change
Junwei Shen
What Are Electric Vehicles?
Electric vehicles (EVs) are transportation alternatives powered by electric motors and batteries, offering a cleaner substitute to traditional fuel-based vehicles.
Importance EVs play a crucial role in reducing global greenhouse gas emissions, particularly those originating from the transportation sector.
Market Growth The global surge in EV adoption reflects a critical shift in consumer behavior and regulatory support
Technological Evolution Advances in battery technology and electric drivetrains have made EVs more viable and attractive to both consumers and industries.


HYPOTHESIS
Because the increasing prices and sales of electric vehicles reflect a growing market acceptance, their contribution to mitigating global climate change is expected to increase.
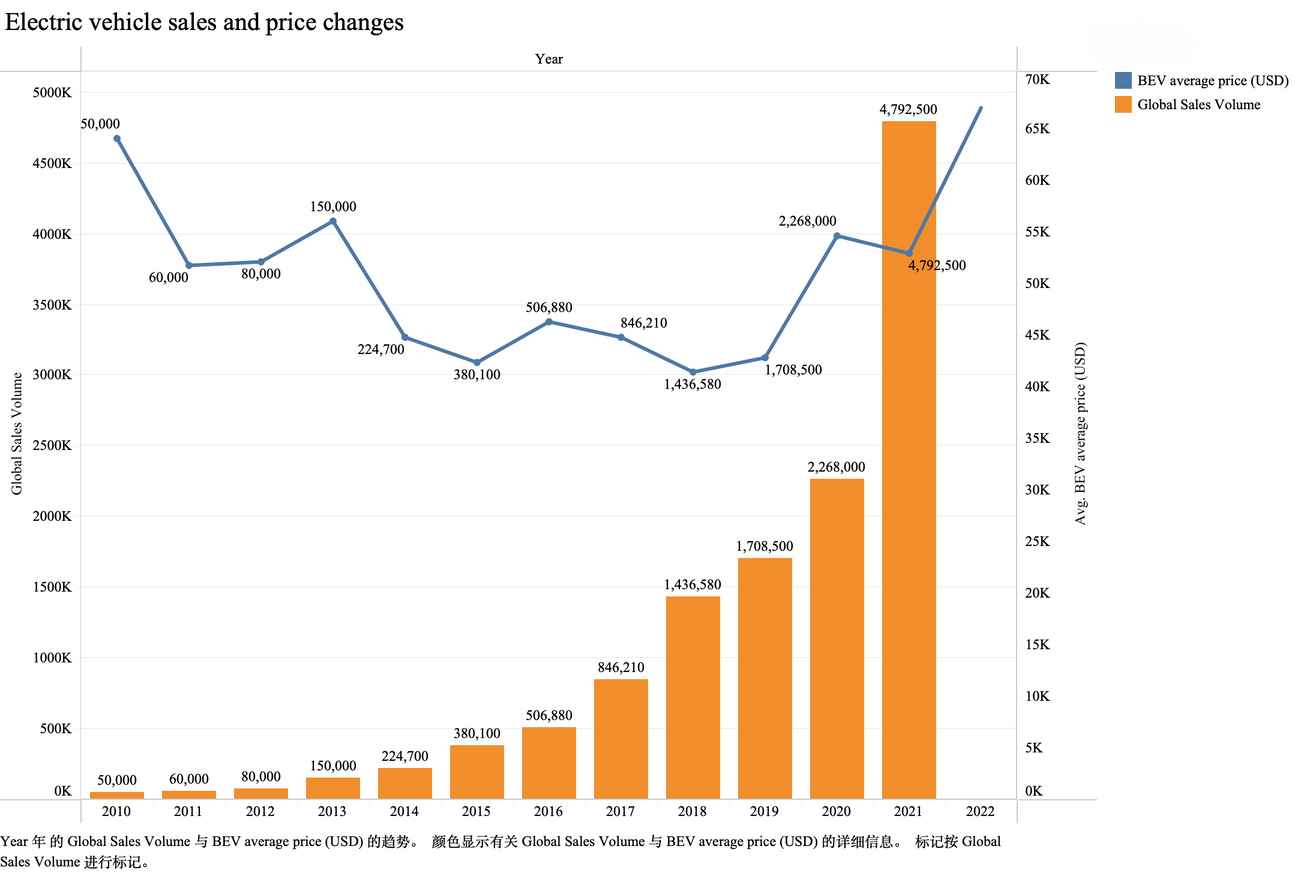
Electric vehicles global sales &price changes

This is an overview of the global sales volumes and price changes of electric vehicles (EVs) from 2010 to 2022. It illustrates a significant increase in EV sales. As the world began adapting to new norms due to the pandemic, the demand for EVs surged dramatically, reaching a peak in 2021. Concurrently, the average price of battery electric vehicles (BEVs) also shows an upward trend, reflecting the growing market acceptance and possibly the increase in manufacturing costs or enhancements in vehicle technology.

Carbon emission rankings of various departments

Dive into this visualization depicting carbon emissions by sector, where the 'Transport' sector stands out as the second highest emitter, right after 'Electricity and Heat.' With transport emissions amounting to approximately 632.2 billion units, it's clear that this area is a crucial target for reducing our environmental footprint. This chart highlights the significant role of transport in global emissions
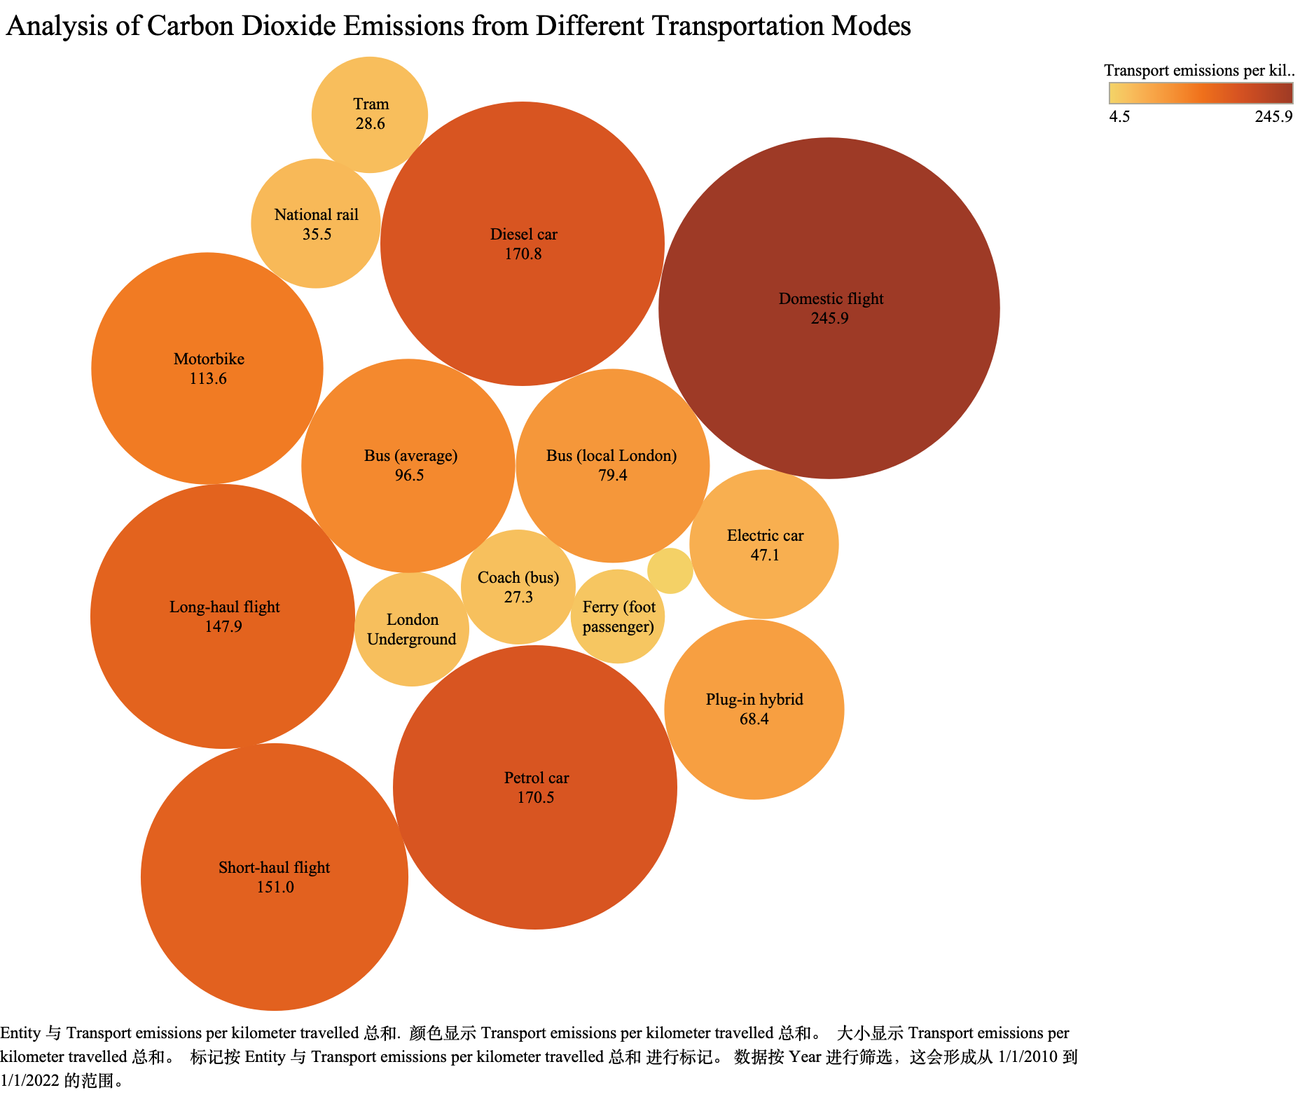
carbon dioxide emissions from different transportation modes


Following the previous graph's revelation of the transport sector as a major contributor to carbon emissions, this bubble diagram further explores emissions within various modes of transport. Notably, diesel cars emerge as the leading emitter among transportation options, evidenced by the second largest and darkest bubble, which indicates a staggering 170.8 units of emissions. This illustrates a clear hierarchy in emission levels across transport modes.
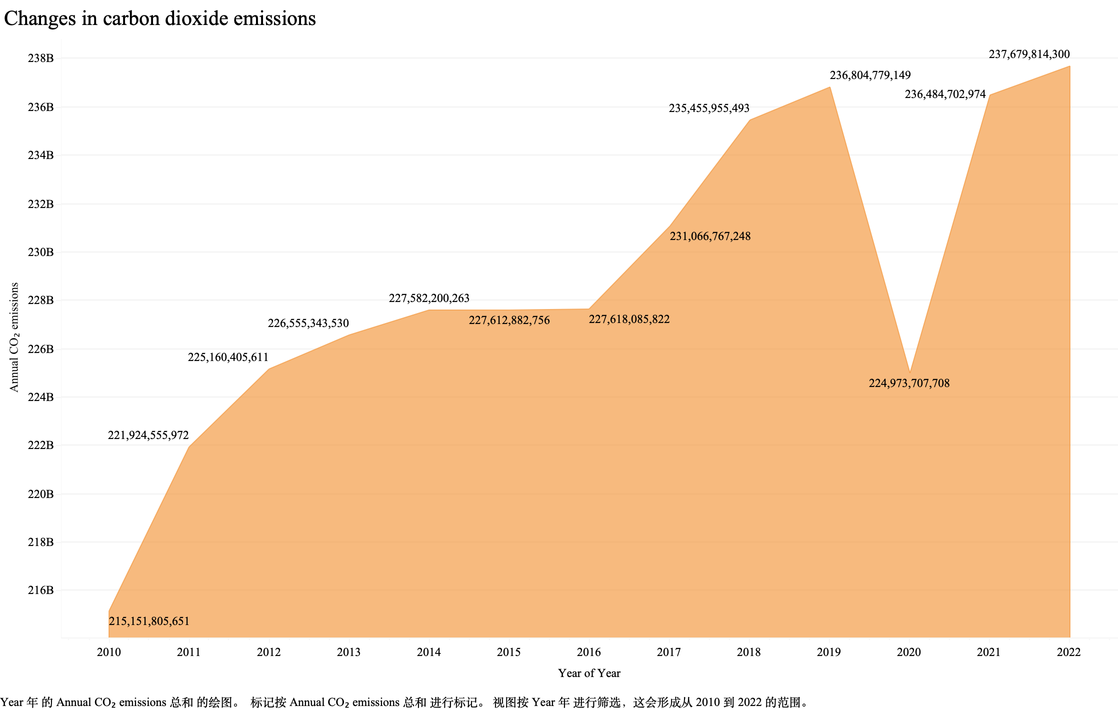
CHANGES IN CARBON DIOXIDE EMISSIONS

This graph traces the trajectory of global carbon dioxide emissions from 2010 to 2022. While there is a general upward trend in emissions over the years, a notable dip occurs between 2019 and 2020. This decline corresponds directly with the global pandemic, which led to reduced industrial activity and transportation usage worldwide, rather than being attributable to advances in electric vehicle technologies. The swift rebound in 2021 emphasizes the temporary nature of this reduction and underscores the persistent challenge of addressing climate change.


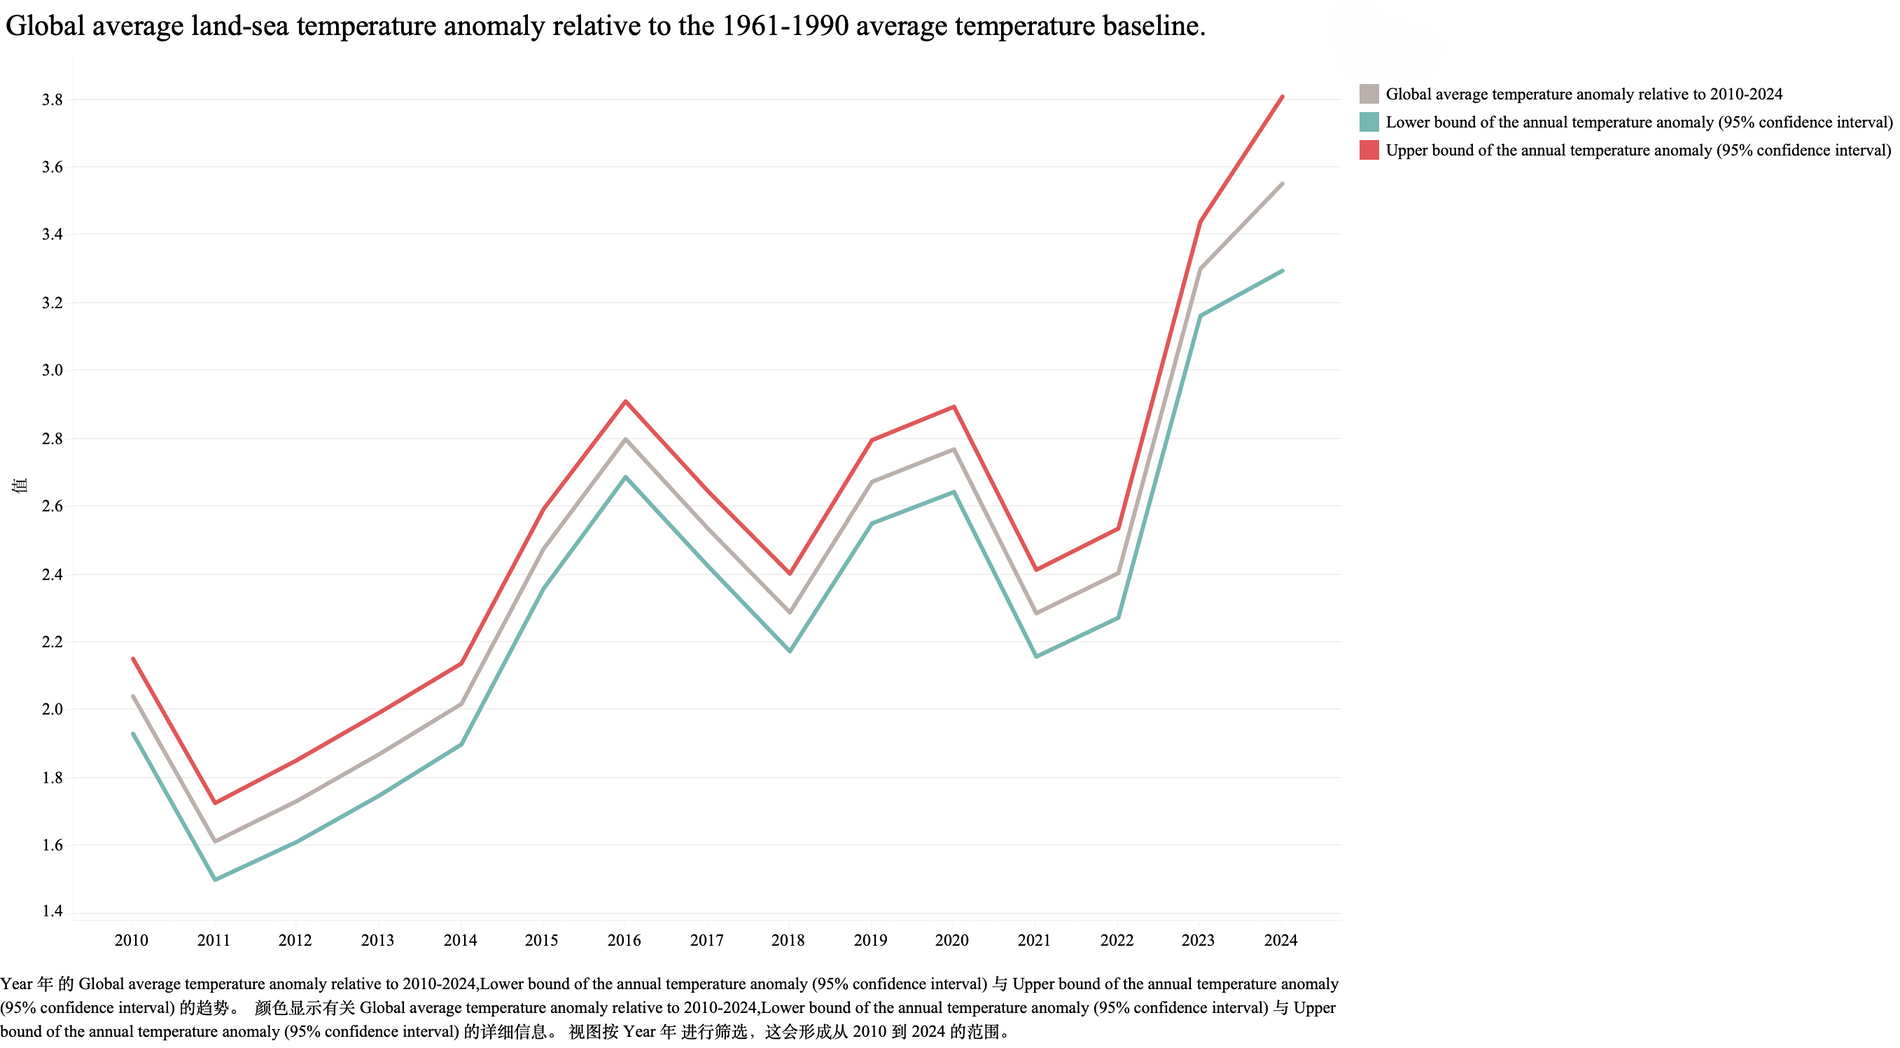
global average temperature trend
This graph shows the trend in global average temperatures from 2010 to 2024. Despite the increasing adoption of electric vehicles (EVs), the data reveals a persistent rise in temperature anomalies, suggesting that broader and more effective measures are needed to tackle global warming.
Conclusion
Although the price of electric vehicles (EVs) has been rising in recent years, accompanied by an increase in sales, their contribution to reducing global temperatures remains limited. Simply promoting EVs is insufficient for significant climate improvement. To effectively address climate change, a more comprehensive strategy is necessary, including enhancing the energy efficiency of EVs, expanding the use of renewable energy, and improving the environmental performance of the overall transportation system.Although EVs alone may not be the solution to global warming, their integration into a more comprehensive approach such as energy production, industry practices, can play a crucial role in shaping a more sustainable future.
Reference
Global temperature / Annual CO₂ emissions by world region
https://ourworldindata.org/co2-and-greenhouse-gas-emissions
Carbon emissions by mode of transportation
https://ourworldindata.org/travel-carbon-footprint
Electric vehicle sales
https://www.kaggle.com/datasets/iannjuguna/electric-car-prices
CO₂ emissions by industry
https://www.kaggle.com/datasets/datamavenx/co2-emissions-by-sector